Dashboard Overview
The Dashboard is the main interface where you can view and manage all your tasks, projects, and activities. It provides a high-level view of your workspace and allows you to dive deep into specific details.
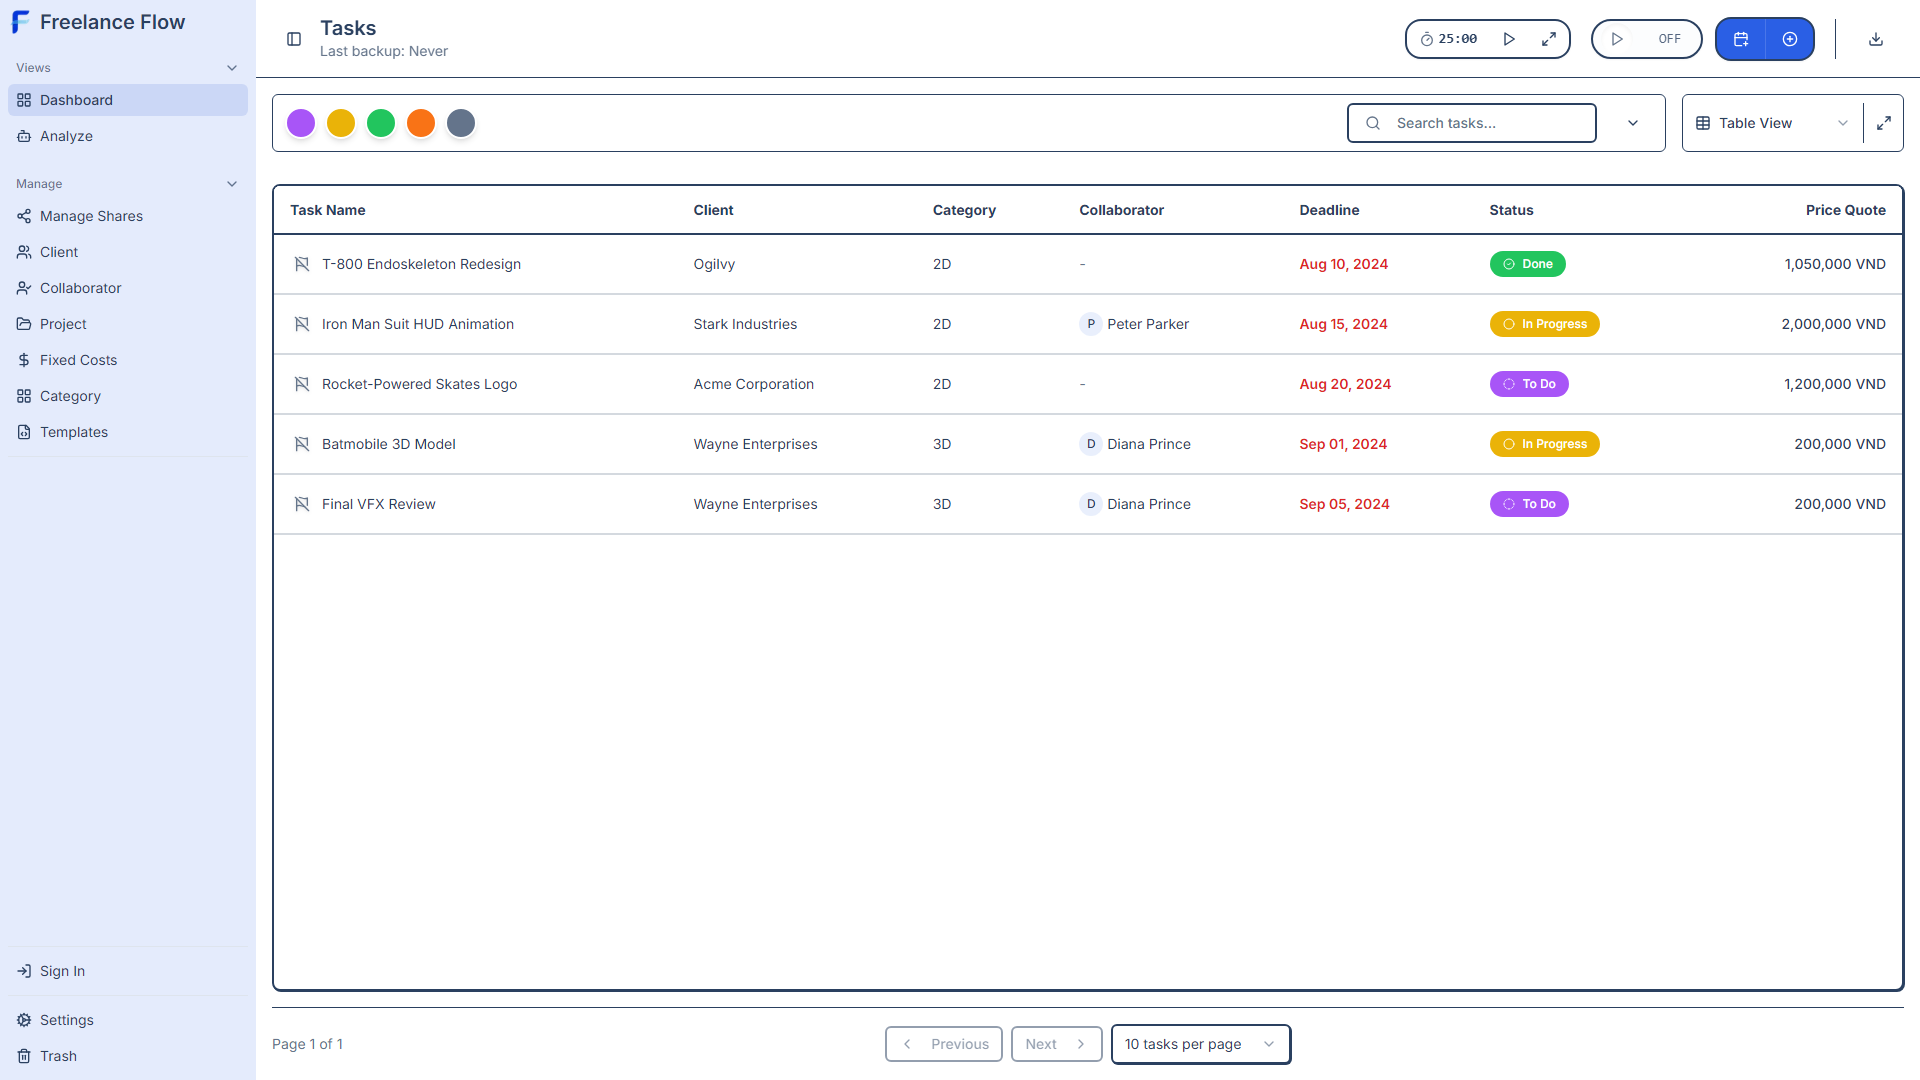
Main Dashboard Components
Sidebar (Left Navigation)
Categorized menu for Views (Dashboard, Analysis), Management (Clients, Collaborators, Projects, Fixed Costs), and Utilities (Notes). Also contains Settings and Trash at the bottom.
Top Header
Displays current context title (e.g., 'Tasks'), Pomodoro Timer controls, and Quick Actions (Calendar, Add New).
Workspace Toolbar
Located above the task list. Contains Status Filters (Color dots), Search Bar, and the View Mode Switcher (Table, Kanban, etc.).
Main Content Area
The central area displaying your data. Shows tasks/projects according to the selected View Mode (Table list, Board cards, etc.).
Available View Modes
Table View
A detailed list view ideal for bulk editing and sorting tasks by various properties.
Kanban Board
Visual workflow management with drag-and-drop cards organized by status columns.
Calendar View
Schedule-focused view to see deadlines and tasks on a monthly/weekly timeline.
Gantt Chart
Timeline view for project planning, showing task durations and dependencies.
Eisenhower Matrix
Priority matrix dividing tasks by Urgency and Importance for better decision making.
PERT Diagram
Network diagram to visualize task dependencies and critical path analysis.
Tips & Shortcuts
Double-click a Status Color Icon to instantly filter by that specific status.
Collapse the sidebar to maximize screen real estate for complex views like Gantt.
Drag and drop tasks in Kanban and Calendar views to quickly update status or dates.
Customize column visibility in Table View via the 'Columns' dropdown.